The Status Quo
Why Tableau has been the BI tool of choice
During a period where the choice of creating data visualizations and dashboards was between Excel or coding, Tableau emerged as the clear and compelling differentiator.
No Code Data Connections
Click, drag, drop to connect to any data source
Drag-and-Drop Magic
Complex charts in minutes, not hours of coding
Simplified Interactivity
Filters & parameters without backend APIs
Democratized Analytics
No coding knowledge required
The Result: Unprecedented Speed
Weeks → Hours: While developers spent weeks building custom frameworks, Tableau users were already iterating on their third dashboard design.
The Disruption
How AI has changed the equation
The emergence of AI means the choice has changed from Excel vs manual coding, to Tableau vs Agentic coding assistant fueled development.
AI-Powered Development
Tools like Cursor, Claude, and Windsurf can generate complete dashboard code from natural language descriptions in minutes.
✓ Generated in 30 seconds
Speed Parity Achieved
The time advantage that made Tableau compelling has been eliminated. Code-based dashboards now develop as fast as drag-and-drop.
The Tables Have Turned
Worksheets vs Components
Worksheet based dashboard building ironically less rapid and scalable than component based
Feature Constraints
Bound by Tableau's built-in capabilities and near-zero feature request responsiveness
Limited Version Control
Dashboard owners need to constantly transfer ownership to allow for editing rights to specific dashboards
The New Reality: Code Wins Long-Term
Same Speed + Infinite Scalability: AI-assisted coding delivers Tableau's speed with programmatic updates, unlimited customization, and enterprise-grade maintainability.
The Vision
Native Remix applications powered by AI
Leverage AI to build native Remix .tsx applications similar to Network360, instead of relying on Tableau for BI dashboards.
AI-Powered Native Development
Leverage Existing Components
Reuse visualization components from Network360 and other BI applications, ensuring consistency and reducing development time.
Dogfood Cloudflare Products
Build on Cloudflare Pages, Workers, and D1 to showcase our platform and force BI team familiarization with Cloudflare products.
Upskill Our BI Team Analysts
Transform our team from Tableau developers to AI future-proofed analysts, expanding their technical capabilities and providing career growth.
Proof of Concepts
Streamlit PoC
Our initial exploration using Streamlit to create a Python-based dashboard at feature-parity with the existing Tableau dashboard.
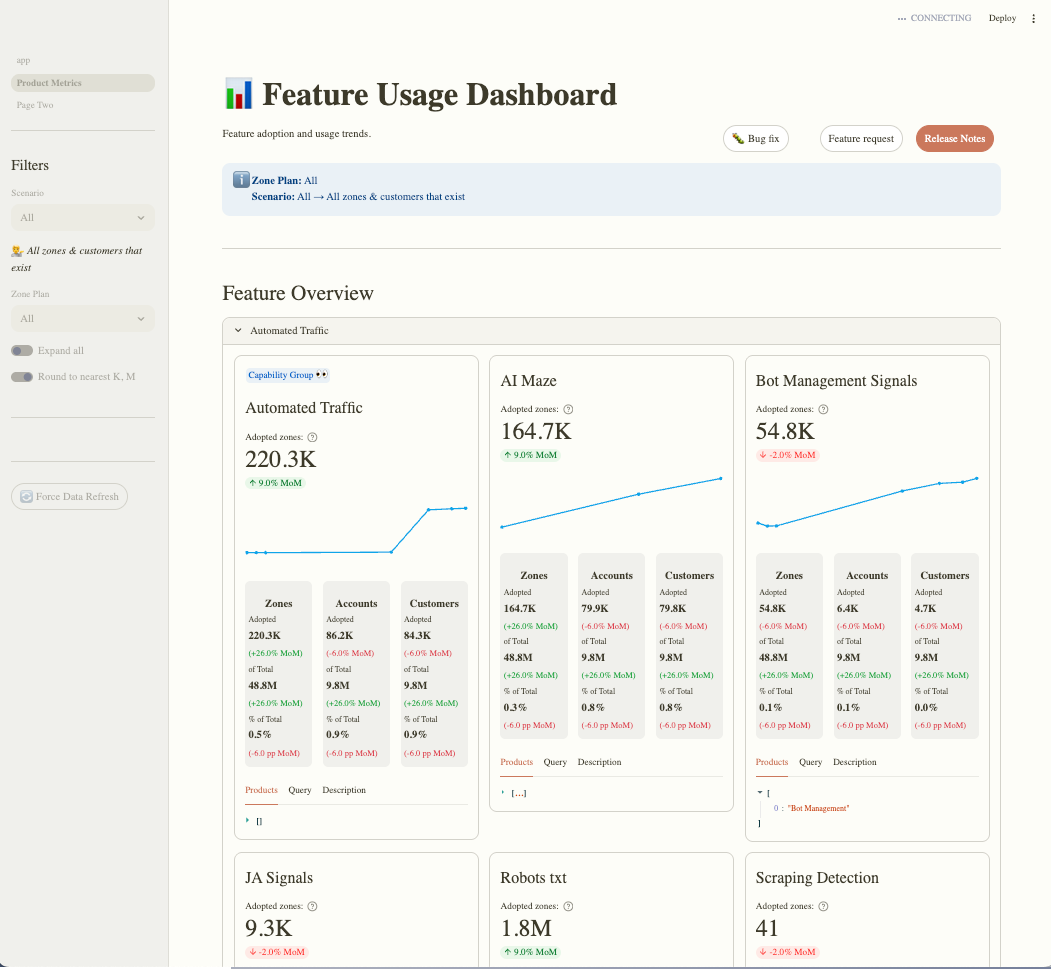
Remix PoC
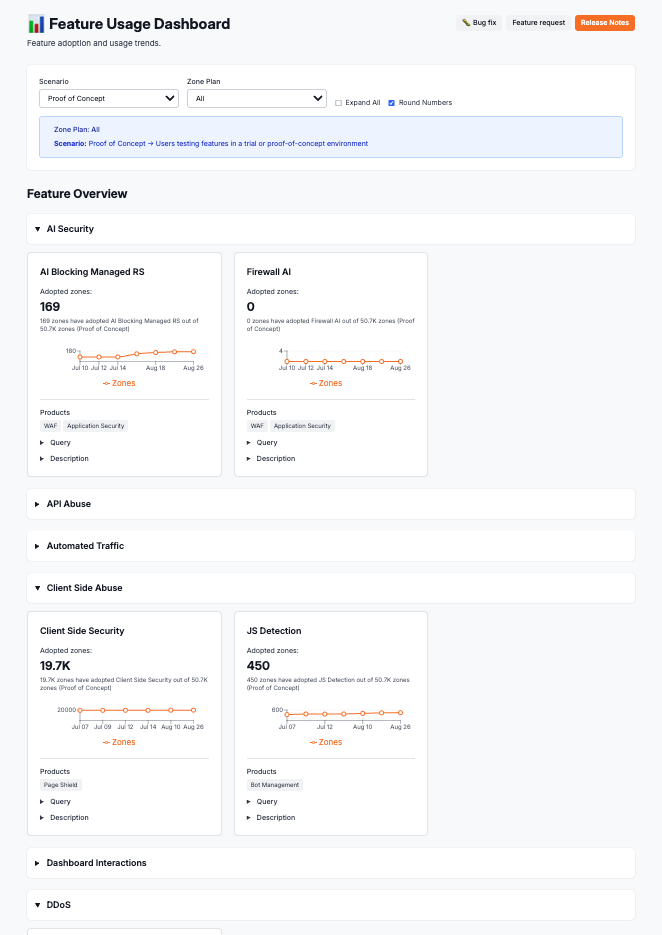
Our second and more customizable itertion of a code based dashbord using Remix while also showcasing full-stack capabilities and native Cloudflare integration.
We're Not Alone
We're not the only team thinking ahead! The ARC team has conducted extensive research and documented their findings in a comprehensive wiki that aligns with our approach.
The Outcome: A New BI Paradigm
Native Applications + AI Development: Deliver enterprise-grade business intelligence with the speed of AI-assisted development and the power of custom Remix applications.
The Ask
Permissions, access, and resource requirements
Image placeholder - Please provide image for Section 4
[Content placeholder - Please provide the story content for permissions, access, and resource requirements]